


Best countries in the world, maybe? 🤨


Topic of the week:
In this week’s issue we are going to tell you what is the best country in the world. Okay, well maybe not. However, we will explore where countries ranked regarding certain economic indicators in 2022.
The analysis below is based on stats.oecd.org data. The country list is not extensive as certain data is not available for all countries worldwide. The insights below will be based on 29 countries, which are shown below.
Countries included in the scope of the analysis:
Inflation
To kick things off, let’s look at our good old friend - inflation. Well, in 2022 it was not such a good friend to most countries. However, in particular the Baltic states and Eastern European countries experienced the highest double-digit inflation when it came to the 29 countries from this list.

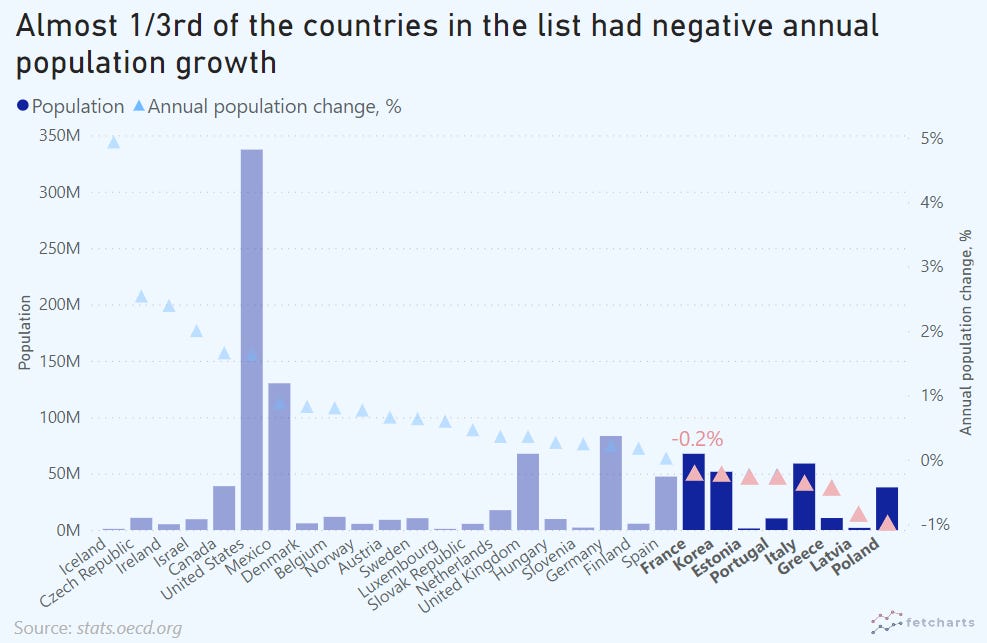
Population growth
Second indicator we looked at was annual population growth. Iceland had the highest annual growth in 2022 with 4.94%. However, it had the lowest population base of just 391k people. There were 8 countries that had negative annual population growth.
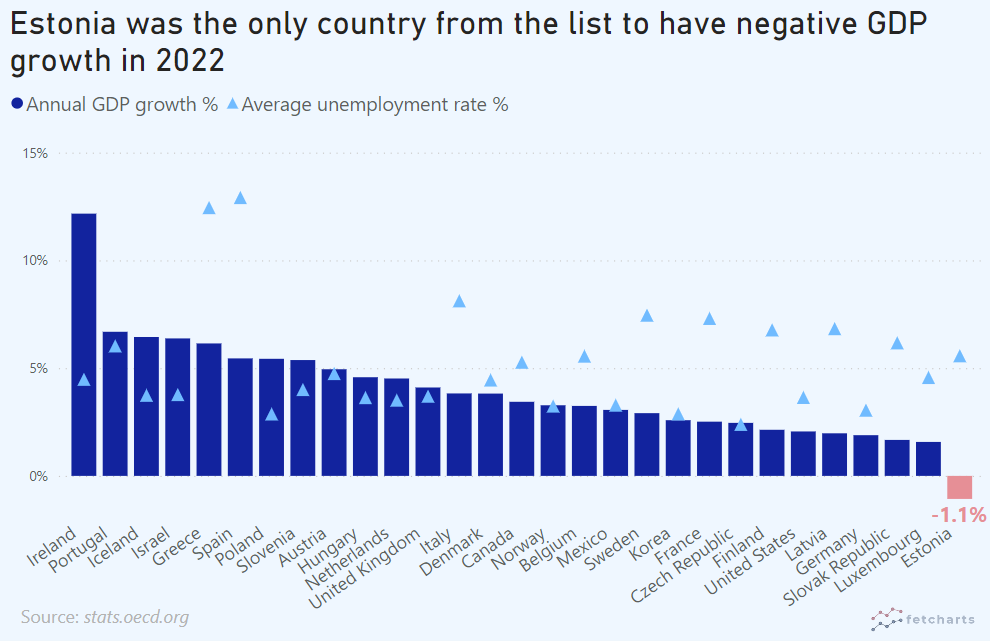
GDP & unemployment rates
The 3rd factor we looked at was annual GDP growth. Out of the 29 countries only Estonia had a negative (-1.07%) GDP change value throughout 2022. Conversely, Ireland was leading the pack being the only country with double digit growth (12.17%) in 2022.
The 4th factor was the average unemployment rate in 2022. Most of the countries from the list, including Korea, US and Eastern European countries had unemployment rates in the 2.5 - 5% range. The two clear outliers were Greece (12.45%) and Spain (12.92%). One of the reasons being is that the working age population (ages 18-65) in these countries have been declining every year since 2007 (2019 & 2020 were exceptions from the trend for Spain).
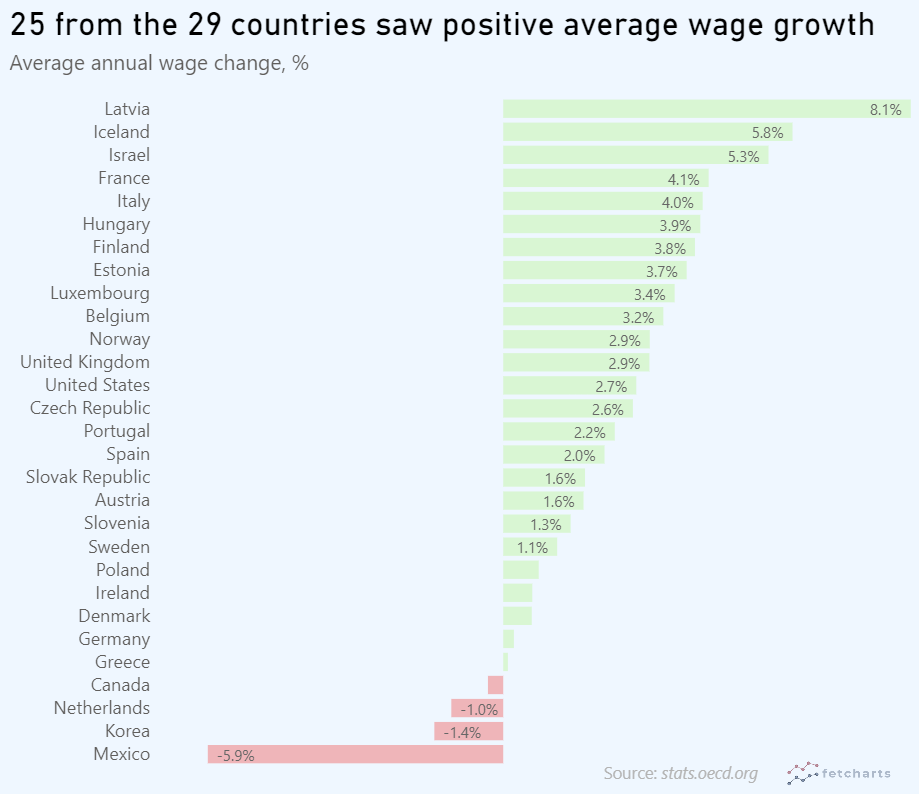
Wage growth
The final and 5th factor was wage growth. For more than 85% of the countries from the list, the wage growth was positive (congrats on the wage increase if you live in one of those countries, we hope you were not the exception to the rule).
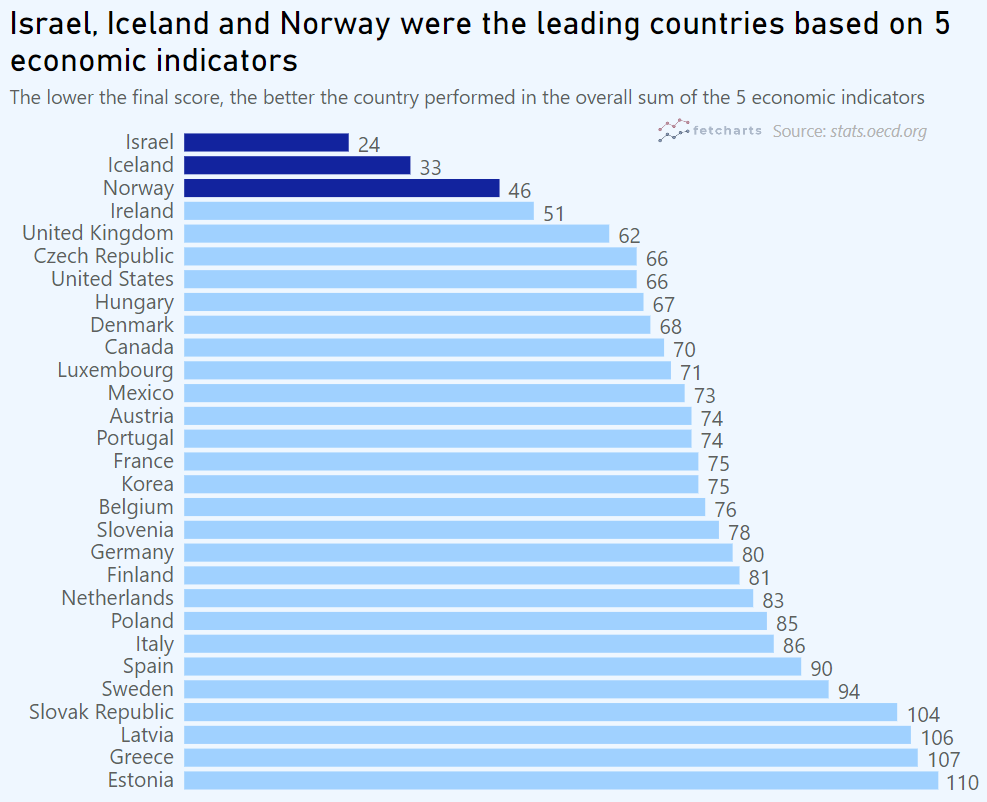
The “Final Score”
Finally, we ranked each country based on the previously discussed 5 economic indicators:
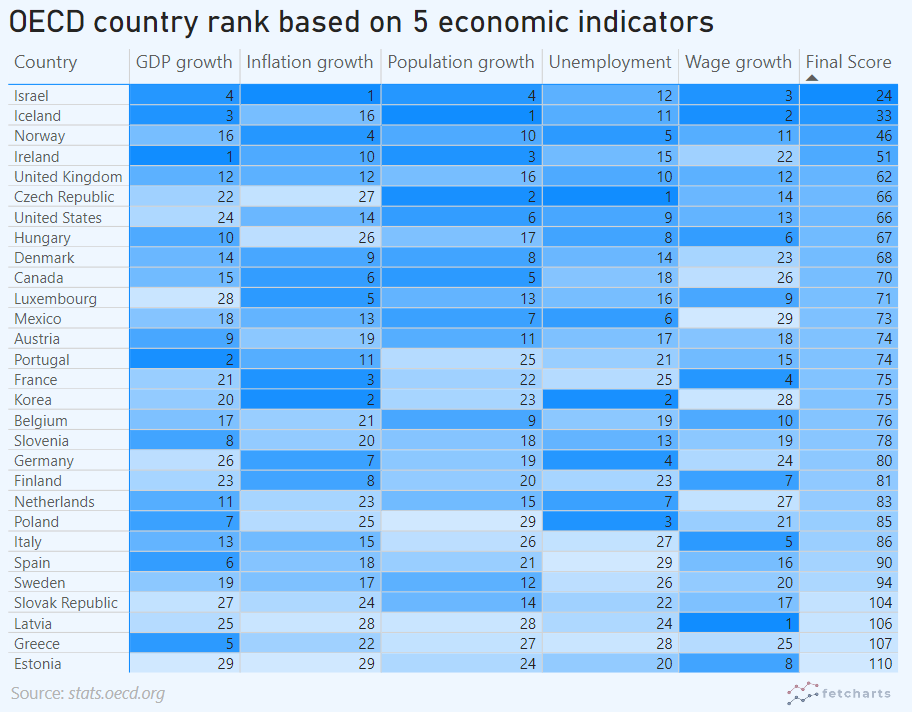
Annual GDP growth: highest growth would be ranked 1, lowest would be 29.
Annual inflation growth: lowest growth would be ranked 1, highest would be 29.
Annual population growth: highest growth would be ranked 1, lowest would be 29.
Unemployment rate: lowest rate would be ranked 1, highest would be 29.
Annual wage growth: highest growth would be ranked 1, lowest would be 29.
The “Final Score” represents the sum for each country of each of the indicator ranks. The lower the sum of ranks (“Final Score”), the better the country did.
For the numbers and data nerds like us, here’s a list of each country’s rank for each of the 5 economic indicators covered in this analysis.
So what?
As can be seen from the table above, you can pack your bags and move to Israel or Iceland (Iceland could use a population boost anyways).
Jokes aside, while this is by far not an extensive overview of how well each country did in 2022, it does provide a decent overview from an economic point of view, which is what we focus on in our newsletters.
Additional factors such as psychosocial are also highly important to have a well-rounded view of a country. However, as we are mostly chart-social and numbers-social, we’ll leave this part to someone else who is better equipped for such a task.
That’s all for this one, see you next week!
Want no BS, witty insights about the Economy, Finance and Tech Start ups with clear visuals weekly?
Sign up for free below
Want smaller chunks of bit-sized charts instead? Check out our Instagram below.