


US Consumer Sentiment Vibes


Topic of the week:
Picking up from where we left off last week (kind of) with US consumer debt, this week we’re delving into US consumer sentiment.
Can any of the broadly used economic sentiment metrics be used to predict price changes of big ticket purchases like homes and cars? Let’s find out.
What’s in the consumer's pocket?
At the initial onset of the COVID-19 pandemic, the majority of people around the world faced rigid restrictions set out by the governments of each nation. With limited ability to go outside people were less incentivized to spend their money. And yes, while e-commerce did experience the golden age during 2020 and the first half of 2021, there’s only so much air fryers, gaming consoles or hair colour products one can buy.
Consequently, personal savings skyrocketed reaching $6T in April of 2020 in the US. During the same month of April inflation was almost non-existent, a measly 0.1%. However, once the Covid restrictions were lifted all of the excess savings and pent up demand was unleashed onto the economy.
As a result, personal savings in the US dwindled to a low of $0.5T in June of 2022, a 12x decline from the 2020 highs. This coincided with the highest monthly inflation of 9.1%.

Varying opinions: consumer vs executive sentiment
Two of the most widely used and easy to comprehend sentiment barometers regarding the economy are the Consumer Confidence Index (CCI) and the Purchasing Managers’ Index (PMI). Some brief lingo to catch you up to speed if you’re not familiar with what these indexes mean.
Consumer Confidence Index (CCI) - surveys 3,000 consumers monthly, comparing their views on the economy, business, and jobs to a 1985 benchmark of 100. Above 100 signals optimism, below - pessimism.
Purchasing Managers’ Index (PMI) - gauges economic trends in manufacturing and services. It polls 400+ senior executives across 19 sectors. A PMI above 50 represents expansion, below 50 - contraction, 50 - no change.
Based on the CCI, the US average consumer has been feeling slightly on the cautious side regarding economic outlook for the past few years now. However, since July of last year the CCI has been slowly ticking up.
Conversely, the PMI has been a lot more volatile when compared to the CCI. This may reflect the different dynamics and a fast paced environment for the executives, who also have first hand consumer data coming in from running their companies, requiring them to adjust their decisions a lot more swiftly.
Whilst since 2022’H2 both indexes have ended up higher, the average consumer at this point in time seems to be more positive, whilst the average manager is getting more cautious based on the last few months data.

What’s the latest sentiment on buying houses and cars?
Looking at probably the two biggest purchases the average person can make, housing and automobiles, consumer demand seems to have somewhat cooled off based on pricing and inventory figures.
During the pandemic craze as people were spending more time at home, a lot of individuals decided to get an upgrade or their first house. The result? From the start of 2021 till the end of 2022, the year-over-year housing price increase every month was in the double digit range, reaching a peak of 18.4% in August 2021.
Since then buying has slowed down, which can be seen by the increased active listings amount coinciding with a normalization of housing price changes.

If you’ve read our previous newsletter on US consumer debt (if you haven’t, shame on you), you might remember that auto loans recently became the largest consumer debt sub-category outside of mortgages.
This coincides well with the chart below, as post pandemic the Auto Inventory-to-Sales ratio has dipped below 1, starting with May of 2021. A value above 1 means there’s excess inventory, a value below 1 would represent a shortage. To no surprise, the good ol’ supply and demand economic theory has been verified here once again - as inventory declined, prices went up. Although a lot more reasonably when compared to housing.
Nonetheless, similarly to housing, demand has cooled off for automobiles. The Auto Inventory-to-Sales ratio has been gradually moving towards equilibrium during the last year, reaching a value of 0.95 in August this year, a high not seen since June 2021.

While it’s all fun and games to know the intricacies of how consumer sentiment affects various economic outcomes, what’s in it for the average Joe or Jannette?
We looked at whether any of the sentiment indicators we have covered so far could predict the price changes regarding two most popular big ticket purchases: housing and automobiles.
Quick methodology overview:
If all you care about is the insights and the “so what” part, feel free to jump to the conclusion. For the data nerds like us, we’re sharing a concise simple overview of the methodology we applied below.
A few things to note on how to interpret the results below:
P value - the general rule is to aim for a value below 0.05, which simply means that we can be 95% confident that the result we got did not happen by chance.
R2 - this shows what % our independent variable (like CCI, PMI, inflation or savings rate) can explain the effect it has on the dependent (Housing or Automobiles price changes, in our case) variable. For instance, if R2 is 35% between Housing price changes and inflation, we can say that inflation explains 35% of the variability in housing prices, while the remaining 65% is due to other unknown factors.
The sample included 56 months of data.
Now that you’re an astute statistics professional, the below table shows the relationships between our variables. The cell where p value is < 0.05 is highlighted in a colour other than white.
As a reminder for R2 - the higher the value, the stronger the relationship.
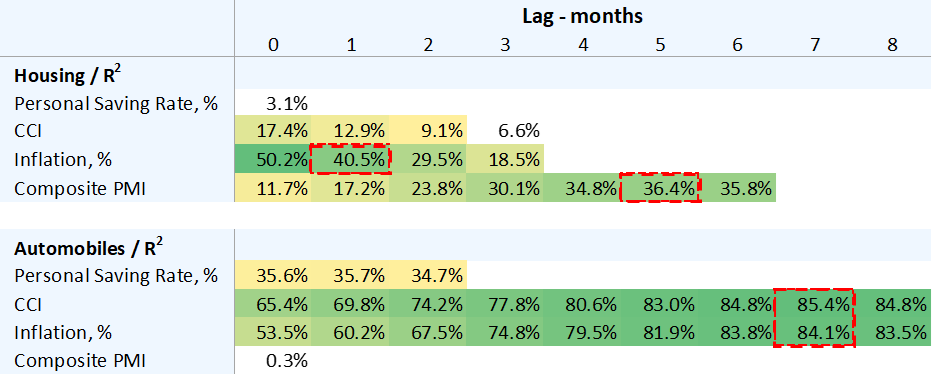
*The cell where p value < 0.05 is highlighted in a colour other than white.
So what?
When it came to housing, from the 4 variables that we looked at, the best predictor was the composite PMI. It explained 36.4% of housing price changes 4 months out. In other words, if the PMI index increased there was a significant chance that the housing prices in the US could also increase after 4 months, potentially explaining up to 36% of the price change.
Regarding automobiles, inflation and CCI were the best predictors 7 months out. Inflation had a positive relationship with automobile price changes, meaning that as inflation increased, so would the prices of cars. This is not surprising, however, it seems that the overall inflation can be a leading indicator for price changes regarding such purchases like cars.
Interestingly, the CCI had an inverse relationship with car price changes. In other words, as CCI decreases, the change in car prices would increase. This could potentially mean that a deteriorating consumer sentiment could be a leading indicator for car price increases, as consumers might be anticipating a worsening in economic conditions for the average person.
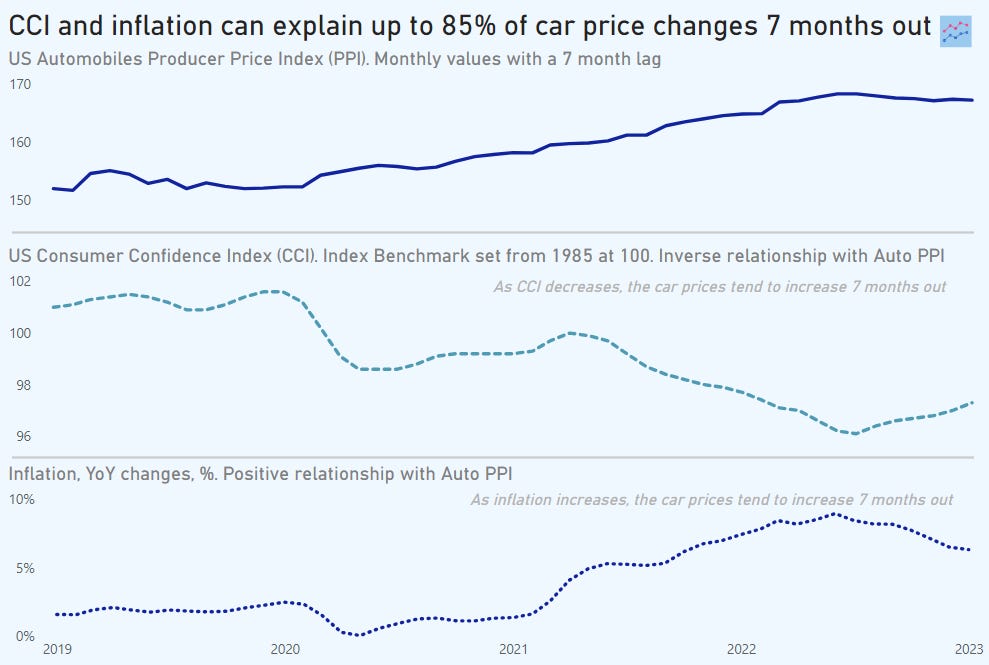
PPI Auto 7 month lag interpretation: for example, a value for inflation or CCI in 2019-Jan is paired with a value 7 months out for Auto PPI, which would be 2019-Aug in this example.
That’s all for this one, see you next week!
Want no BS, witty insights about the Economy, Finance and Tech Start ups with clear visuals weekly?
Want smaller chunks of bit-sized charts instead? Check out our Instagram below.